Getting started
What is BREEZE?
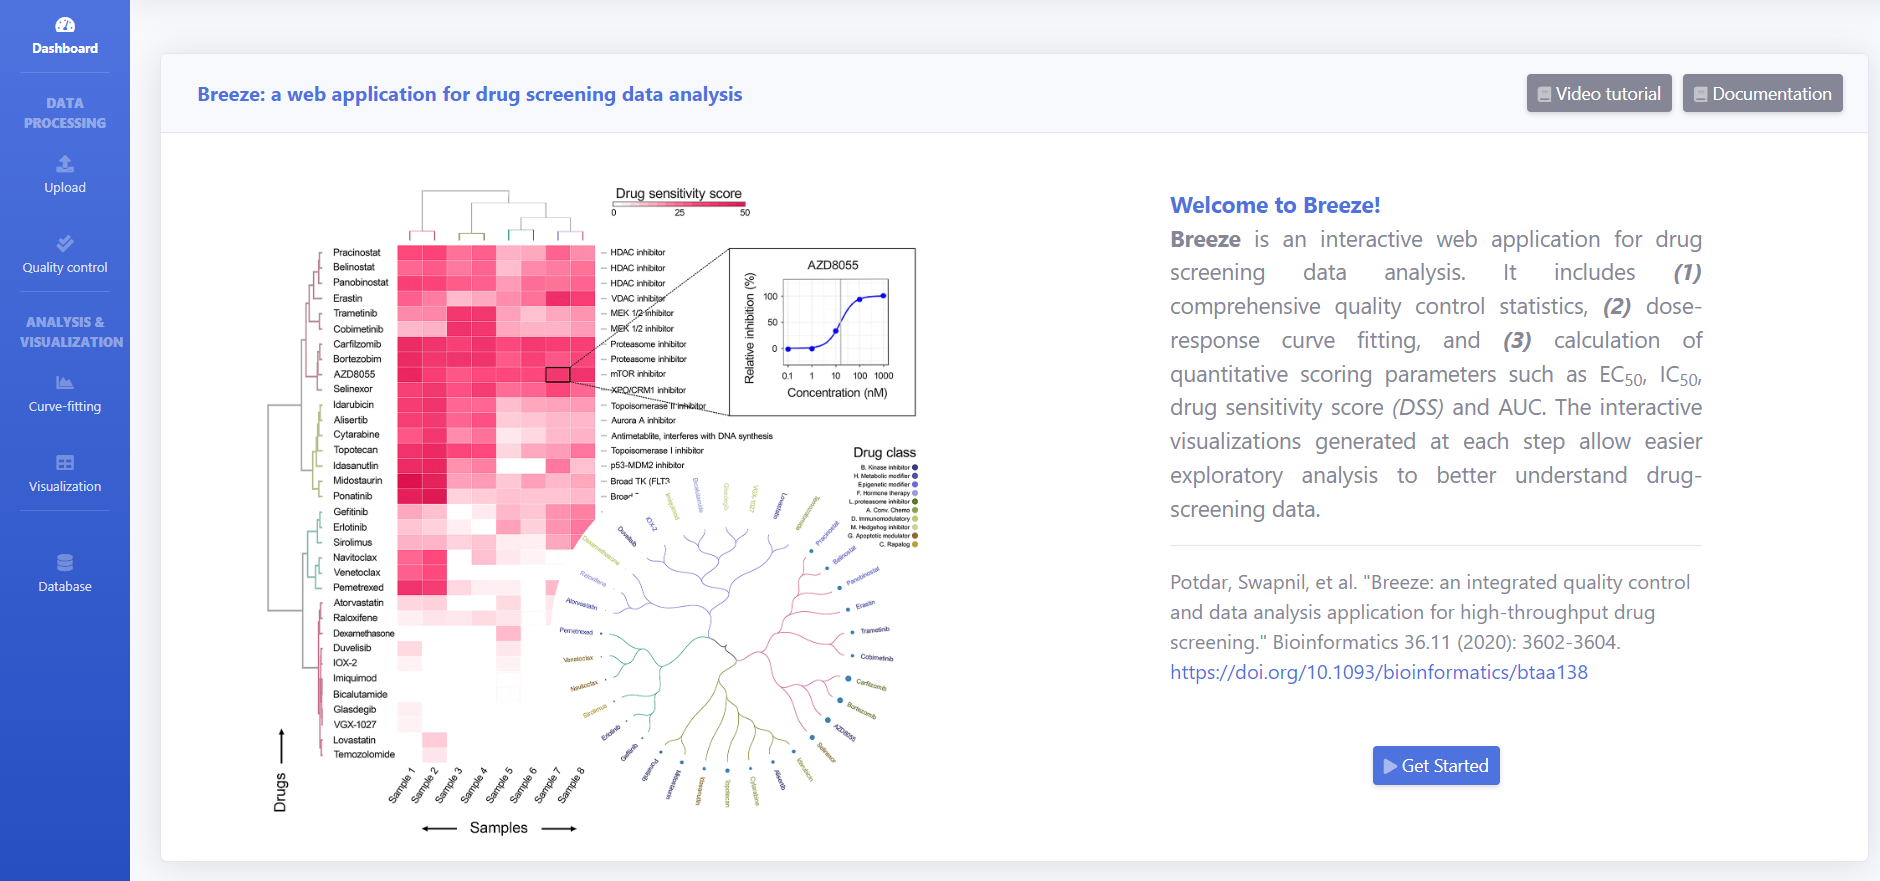
BREEZE is a web based interactive application for analyzing drug screening data and exploring publicly available curated datasets. BREEZE application combines the comprehensive quality control, dose response fitting and calculates the quantitative scoring parameters such as EC50, IC50, drug sensitivity score (DSS) and area under the curve (AUC). The interactive visualizations generated at each step helps the understanding of data and exploratory analysis. For the users interested in exploring the publicly available datasets without running the report, you can directly click on 'Database' button to launch the Visualization page.
Getting started with BREEZE:
BREEZE is hosted at following address https://breezetool.app/ or http://breeze.fimm.fi
For guided tour, click on "Video Tutorial" . To analyze the data follow Steps 1-7.
Terminology
Detailed explainations of terminologies used
Inhibition or viability readout
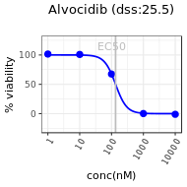
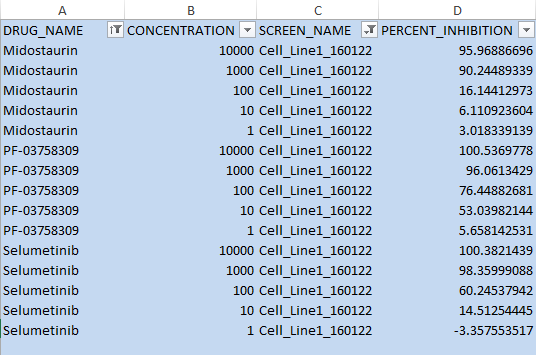
- The screening assay readout shapes how we look at the data. In the Inhibition/Toxicity readout we are interested in looking at how compound treatment has affected the target or toxicity to the cells. At the lowest concentrations, the treatment is not expected to inhibit any pathway/protein targets and as a result kill the cells. On the other hand higher concentrations may have some impact on the cells with increased target inhibition. Viability or inhibition percentage is calculated by comparing the raw values from a particular well to the mean raw values of positive and negative controls as upper and lower baselines. In this context for the lowest concentration of drugs, the percent inhibition is 0% and at the highest concentration of a typically toxic drug the percent inhibiton may be approaching 100%. As you can see from the figure at lowest concentration of 1 nM, the Percent Inhibition is close to 0 .This means drug concentration is not high enough to inhibit targets to bring about a change. As the concentration increases to 100 nM and 1000 nM the target inhibition increases so does the percent inhibition.Positive and Negative Controls
- Positive and negative controls play important role in the interpretation of biological assay. The data is normalized against positive and negative controls so that interplate variability and range can be minimized. A negative control would mean that it will not have any impact on the cells while positive control is the treatment which will have maximum response. DMSO, which is frequently used as a negative control does not interfere or inhibit cell cycles and is used as a vehicle/solvent for many compounds. Since DMSO does not affect cell viability, the wells with DMSO treatment are always consistent. A toxic compound like Benzethonium chloride(BzCl) which is a potent proteosome inhibitor and kills all the cells in the well is used as a positive control. The positive and negative controls form the boundaries of higher and lower baselines. The readout type would determine the intensity or raw data values of these controls. For example in the viability readout like CTG, the Fluorescence is detected from the viable cells so more viable cells in a well will mean higher raw value/intensity and less number of viable cells will mean smaller raw value/intensity. That means the wells with just DMSO will have more viabile cells and more signal/raw intensity values and on the other hand the wells which have toxic compounds like BzCl will have less number of cells and less intensity value. As expected in the toxicity readout, the BzCl wells will give more signal and bigger intensity values and DMSO wells will have very small signal.

- Curve Fitting methods - Curve fitting is an important part of the dose–response data analysis and involves fitting the percent inhibiton values at each point of the concentration range
and fitting these points using four-parameter logistic (4-PL) model. Dose-response curve fitting:
Fitting a dose-response curve over the full concentration drug range using 4 parameter logistic regression:
- Quantification methods IC50/EC50/DSS/AUC - Breeze offers several possibilities to summarize dose–response relationship into a single metric including IC50, EC50, AUC and DSS. Drug Sensitivity Score (DSS) DSS scoring metric is adding normalization to standard Area Under Curve metric (Yadav et al., 2015, https://doi.org/10.1038/srep05193). This standardization facilitates the correlation of drug sensitivity and resistance testing results across several studies.
- IC50, EC50: IC50 is half maximal inhibitory concentration. This is the concentration of drug or compound required to bring about 50% inhibition response. EC50 is half maximal effective concentration that produces a 50 % response of maximum effect. AUC: Area Under the fitted dose response Curve

Simply put, %inhibition responses are usually around zero at the lower doses of drugs, and around the maximum values at the highest doses. In case your data follow the opposite pattern, choose %viability as the readout.
Database Exploration
If you want to explore the published datasets without running the data analysis pipeline, click on Database button.
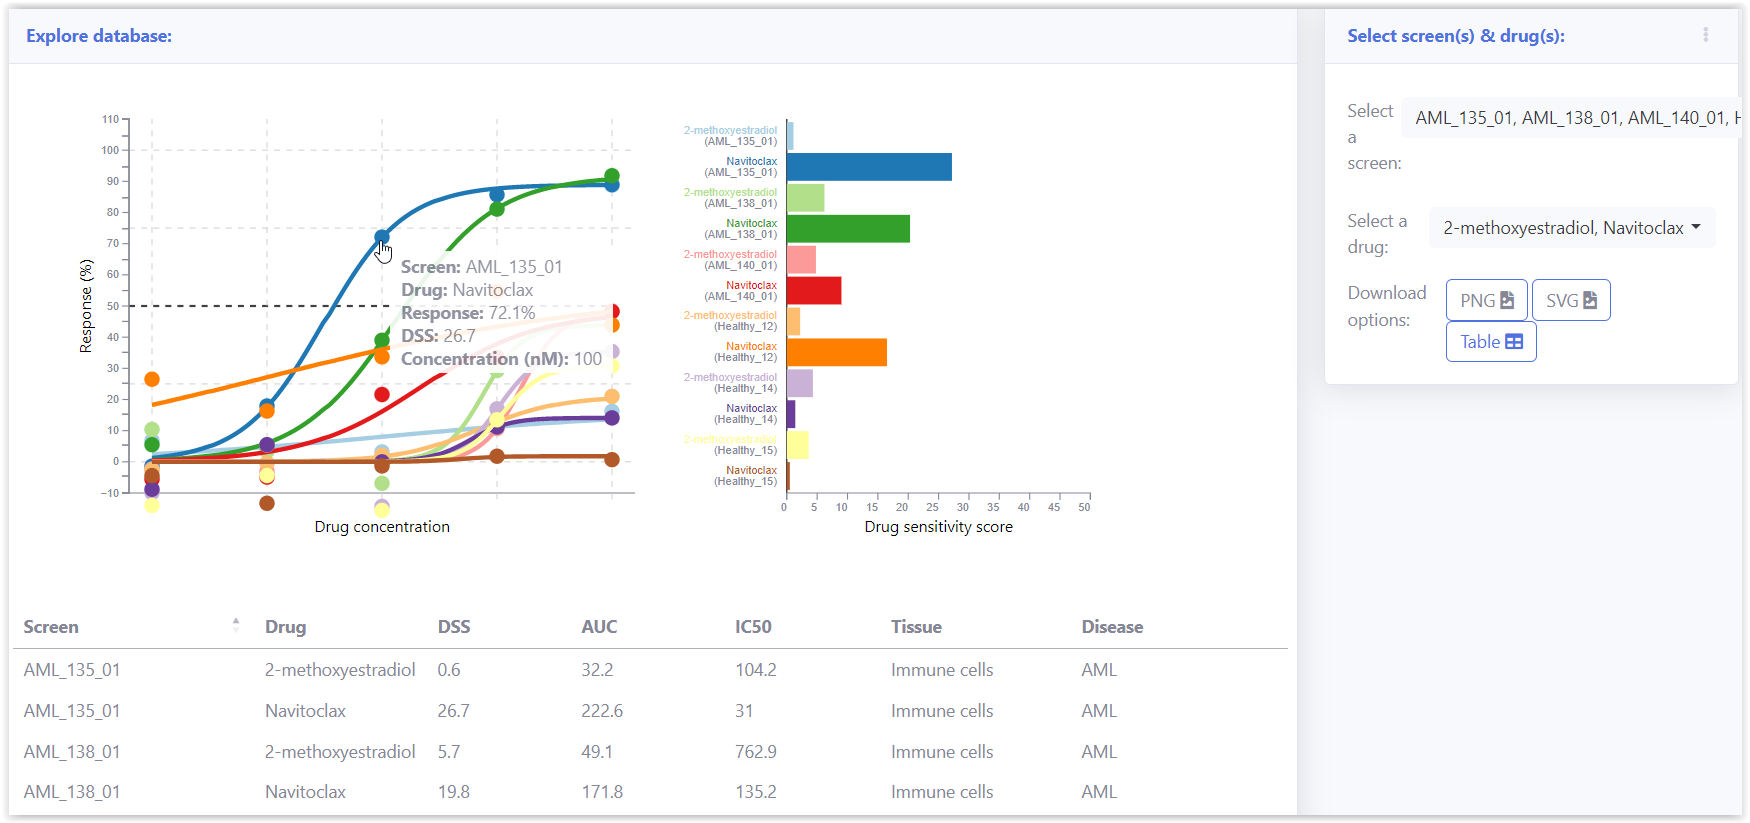
Breeze database stores data from carefully curated publicly available datasets. This includes data from large datasets like PharmacoDB, publications like Malani et.al. which also has number of AML patient samples and healthy control samples. User can select drugs and screens from the drop down menu and explore the dose responses overlaid. The overlaid dose response graphs help users to explore selective responses of drugs compared to different cell lines and healthy controls.
Input data
- Click on Get Started button to initiate the workflow.
- Upload an input data file by choosing the file or dragging it on the file upload area. The selected input data should be in the tabular format of Excel/ CSV/ TXT. Please download the Demo Data files for the reference.
- Select the readout in inhibition/viability and clustering method.
- Select the Curve Fitting method 4PL or LOESS. 4 PL or 4-Parameter Logistic curve fit method is the default choice. For data that has more variability in the direction, user can opt for LOESS.
- Select the Clustering method from the drop down menu, to be used for the heatmaps.
- Select the DSS method from the drop down menu. DSS2 works optimally in most cases and is the default method.
- Upload the controls file (if needed to calculate the selective drug sensitivity scores (sDSS))
Annotation data file
Two input file formats are possible in the BREEZE application:
1. Raw data format: Raw data (raw plate reader output data, unprocessed or preprocessed measurements from drug screening experiment) arranged in tabular format which can be run through the pipeline of QC, dose response curve fitting, IC50, EC50, DSS etc. Here we need to calculate the percent inhibition for each well and hence we need to know where the controls are. The DRUG_NAME of positive controls is denoted by ‘POS’ or ‘BzCl’ and negative control by ‘NEG’ or ‘DMSO’. Percent inhibition is calculated per plate.

2. Pre-calculated percent inhibition/ percent activation values which can be run in the same way without quality control step. This is useful if we have only inhibition/activation data and no raw data.
The demo data for both the input types is provided in the example data section of upload page.
The controls
If you have drug sensitivity scores (DSS) from a control screen, you can calculate a selective drug response based on those values. You can simply upload the excel-file with the DSS from the controls. There is now an "Upload Control" button on the data input page, which can be used to upload a simplified tabular file containing two columns: "DRUG_NAME" and "Controls". The "DRUG_NAME" column lists the names of the drugs, while the "Controls" column provides their corresponding control values. These values could be derived from a single screen or represent an average DSS value from multiple screens. This is useful especially when you want to calculate response with respect to healthy control vs patient or difference between two cell lines. The heatmaps and tables are generated based on the selective drug sensitivity scores (sDSS). E.g. Paclitaxel has DSS of 12 in the control screen and your current screen paclitaxel has DSS of 19, so the selective response is 19-12=7.The demo data is provided in the example data section of upload page.
Data input terms
BREEZE accepts data in text, CSV, excel-files in tabular format. Here is the short glossary of the terms used in the data input:
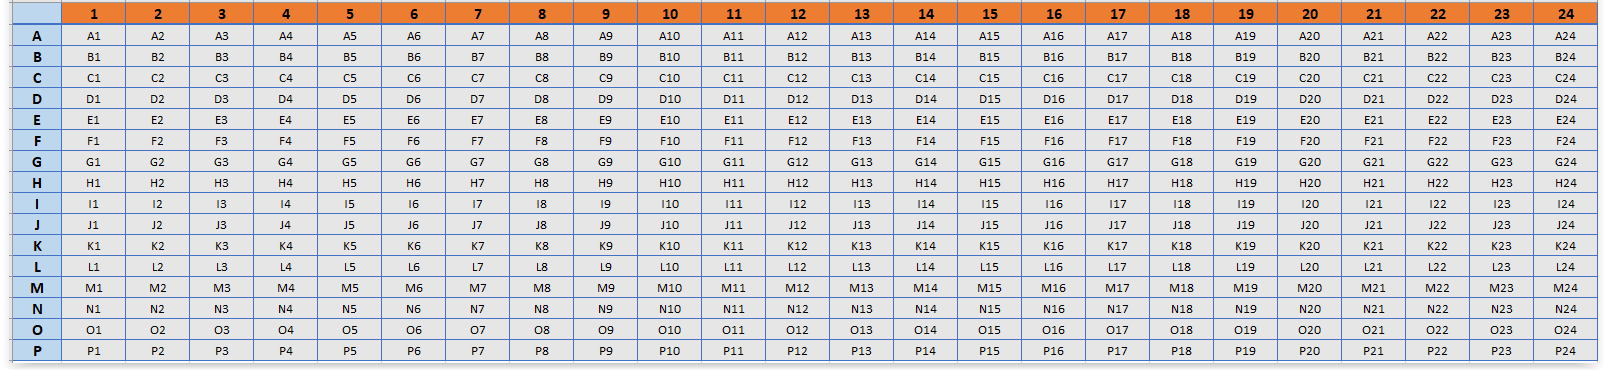
- WELL - The well identifier. A10, B11, C12, etc. “A10” specifies row ‘A’ and column 10 of a 384-well / 96-well plate. Please refer to the representative 384 well plate design.
Breeze checks if data originates from 96-well / 384-well plate. Breeze can handle 1536-well plate data as well however there might be few aberrations in the plots due to space.
- PLATE - Serial number of a plate in the plate-set (numeric). If you have multiple plates, the plate are numbered: 1,2,3, etc. QC is calculated per plate.
- DRUG_NAME – Name of the drug.
- POSITIVE_CONTROL – Death control (toxic compound like benzethonium chloride that kills most of the cells). In the raw data, positive control can be referred as POS or BzCl.
- NEGATIVE_CONTROL - DMSO or similar which should not have any effect on the cells. In the raw data, negative control can be referred as NEG or DMSO.
- CONCENTRATION - Concentration of compound in nano molars (nM). (The users must provide at least 4 doses for each drug)
- SCREEN_NAME - Unique name used to identify screen. E.g. if you have cell line MCF7 which has been screened twice for 50 drugs. You can name the first screen as MCF7_1 and second as MCF7_2.
- WELL_SIGNAL - The raw value of each well.
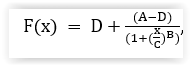
- PERCENT_INHIBITION - The percent inhibition or activation value is calculated by comparing the raw values of a particular drug at a particular concentration to the positive and
negative control values in the same plate. The formula to calculate percent inhibition is as follows

- After uploading input data files, click Start button,this will bring the progress bar.
- Once the Quality Control step is completed the Analysis & Visualization button will be active to analyse and see the results.
Output data
Results
On the Visualization tab, you can click on "Download" to download the entire results folder that includes the QC results, dose response curve fits in excel-file, DSS and sDSS tables and interactive heatmaps. The parameters used to run the data along with the report ID and link are stored in the file 'Analysis options.txt'. The web link of this report is unique and you can come back to the same page if you save this link.
There are three main aspects of the report which are Quality control, Curve fitting, and Visualization of results.
Quality control
Quality control statistics give valuable information about the plate quality, technical issues if any and overall reliability of the data. Comprehensive table gives various numeric cutoffs, like Z’ and SSMD, are reported along with several parameters calculated for each of the control. For a good quality plate, Z’ should be above 0.5 and SSMD above 7. Out_To_In_Controls should be between 0.9 and 1.1, while CV_Neg and CV_Pos below 10.

The Z' factor (called as Z Prime factor) describes the available signal window for an assay in terms of the total separation between negative and positive controls minus the error associated with each type of control. For a good assay, Z' value should lie between 0.5 and 1. Plates with the Z' value below 0.5 should be treated with caution. http://en.wikipedia.org/wiki/SSMD SSMD strictly standardized mean difference and is used as a QC parameter measuring effect sizes for the comparison of any two groups with random values.
Labeled z-score figure is useful for those who would prefer not to look at the full QC report and just want a minimum information to ensure good quality of the plate.

In this example, 4 plates have Z' above 0.5 (which we can see from the barplot above).
The application generates plate level scatterplots of the raw data indicating different controls and samples. Users can look for trends in the distribution of the raw data. Positive controls are colored blue, negative controls in red, cells in green and drugs or compounds in gray.

Plate heatmaps are false color images of the assay plate based on the raw data. They help in spotting edge effects, dispensing problems and other technical issues.

Plot A and B represent data from the same drug set and same cell line screened at two different time points. In plot B, unusually low numbers are present throughout row E, possibly resulting from dispensing issues and checkerboard pattern is evident in rows H to M.
If percent inhibition provided as input, no QC results will be generated.
Dose response curve fitting
Dose response curve fitting starts with arranging the percent inhibition values at each of the concentration of a particular drug of a particular screen.
The dose response is fitted using four parameter logistic curve fitting.
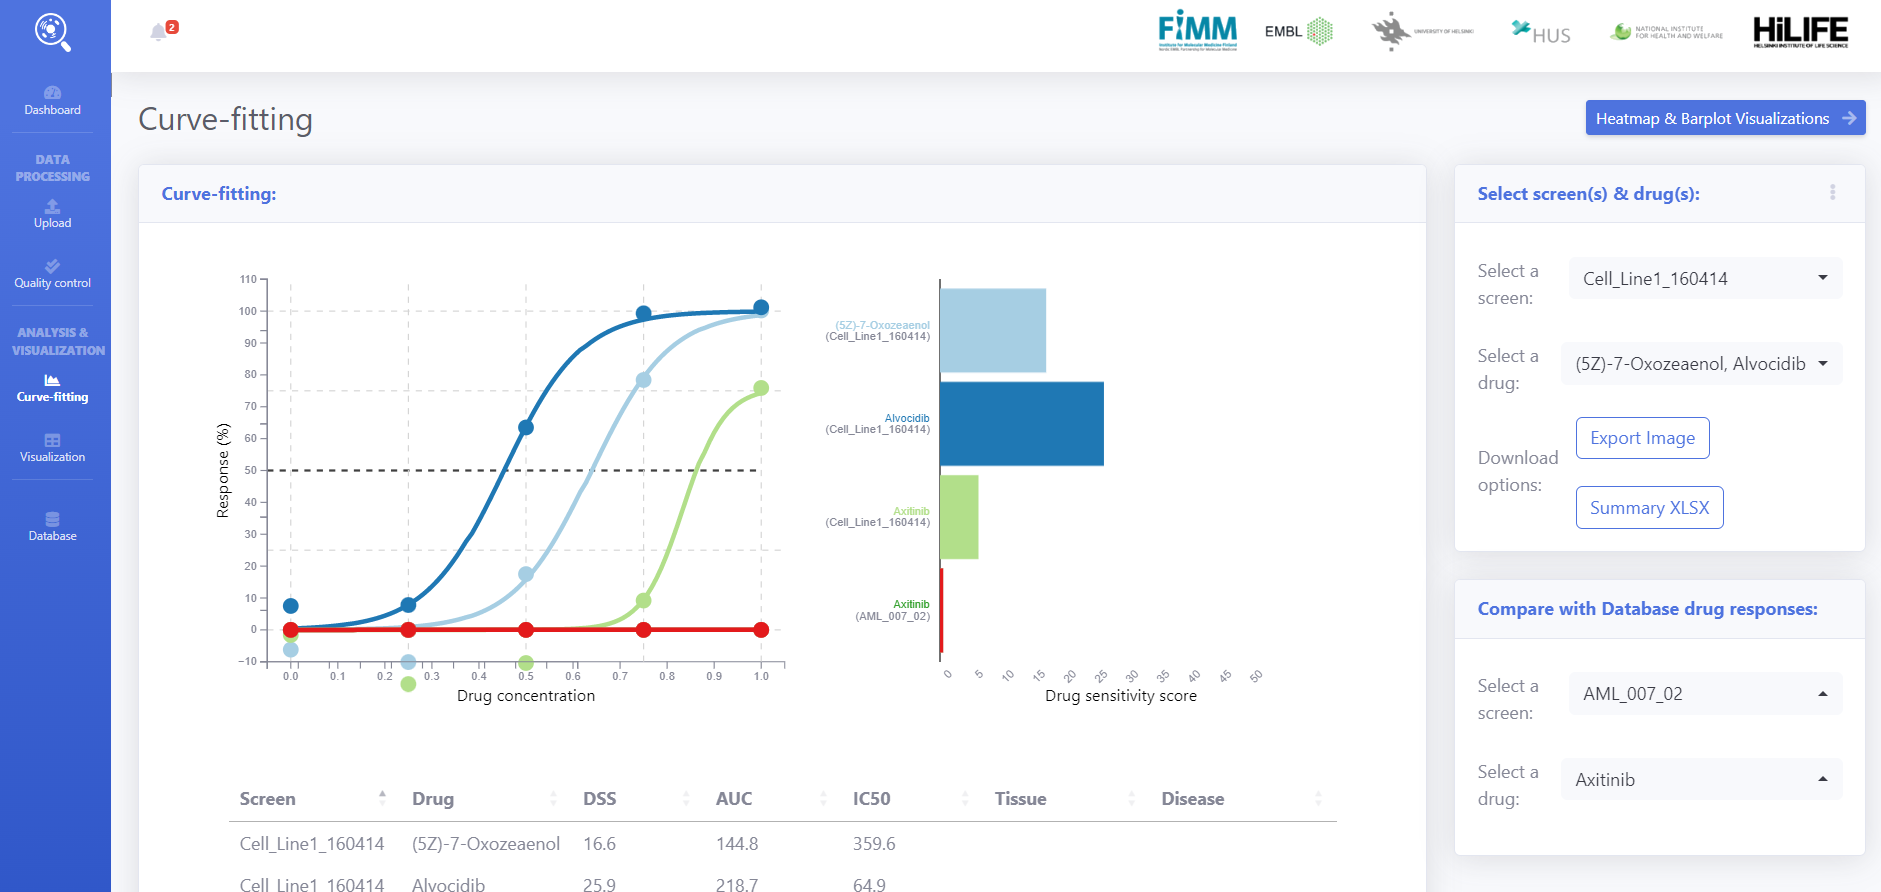
 On the curve fitting user can interactively explore dose response curves from the analysis and also use the data from Breeze DB for comparative analysis.
On the right panel, User can select one or more screens and drugs from the newly analysed data and the published data from database. Summary table in the bottom panel shows the drug quantification metrics.
On the curve fitting user can interactively explore dose response curves from the analysis and also use the data from Breeze DB for comparative analysis.
On the right panel, User can select one or more screens and drugs from the newly analysed data and the published data from database. Summary table in the bottom panel shows the drug quantification metrics.
 The quantification metrics such as IC50. EC50, AUC, DSS are calculated and exported in the form of excel files. Different types of reports (%Inhibition/ %Viability) can be displayed by switching between worksheets of produced excel reports.
The example of bad and good curve fits is presented bellow.

Good curve. Bad curve Bad curve
We utilized machine learning based approach for marking bad quality dose-response curves (in red color). This is how it is displayed in the report excel files:

Data output terms
- DRUG_NAME - Analyzed drug name.
- ANALYSIS_NAME - IC50 / EC50 (% Inhibition or % Viability data).
- IC50 – Relative IC50 value, the concentration at which the maximum response is reduced by half.
- EC50 – Relative EC50 value, the concentration at which the maximum response is reduced by half.
- SLOPE - Slope of the fitted dose-response curve.
- MAX - The highest asymptote of the fitted dose-response curve.
- MIN - The lower asymptote of the fitted dose-response curve.
- Min.Conc.tested - The smallest tested drug concentration.
- Max.Conc.tested - The highest tested drug concentration.
- EC50_std_error - Standard deviation of IC50/EC50 value.
- DN - Percent inhibition value at N-th concentration.
- AUC - Parametric area under the dose-response curve .
- GRAPH - The graphical illustration of dose-responses curve.
- DSS - Drug sensitivity score.
- sDSS - Selective drug sensitivity score (deviations between sample and control DSS scores; used only when control is provided).
- SE_of_estimate - Standard error of estimate for curve fit.
By default we utilize a highly popular four-parameter logistic (4PL) nonlinear regression model for dose-response curve fitting (see fig. below, left panel). We do recommend this option for its great robustness to outliers.
However, in certain scenario, the dose-response curve may not follow sigmoidal pattern (e.g. U-shaped dose-response curve). For this, we implemented a LOESS fit as an alternative option.(see fig. below, right panel).


Visualization of results
By default we utilize a highly popular four-parameter logistic (4PL) nonlinear regression model for dose-response curve fitting (see fig. below, left panel). We do recommend this option for its great robustness to outliers. However, in certain scenario, the dose-response curve may not follow sigmoidal pattern (e.g. U-shaped dose-response curve). For this, we implemented a LOESS fit as an alternative option.(see fig. below, right panel).
Visualization of results
AUC and DSS scores are reported in the form of the excel-tables of all the screens as well as interactive graphics such as heatmaps. The interactive heatmap shows the curve fit of a particular drug by hovering over the value on the heatmap. By clicking on the drug name, you can view and compare dose-response curves across all the samples. Please note, that we implemented different distance metrics for heatmap clustering. Euclidean distance is used as default option, but other options, such as Pearson correlation, were shown to be powerful to detect similarities between drug response profiles.

Waterfall plot shows top active drugs only for a particular screen.

If the controls are provided then the heatmaps of selective DSS along with excel-table is also produced.
Clustering tree is a radial dendrogram for each drug with corresponding DSS values.It shows the mean DSS value across all the samples by hovering over the blue dots on the tree.

Downloading results
All the results including QC, Curve fits and visualizations can be downloaded from the Visualization page. Users can export out individual plots by clicking on Export image button on relevant pages. The output results include a text file "Analysis options.txt" which contains all the parameters used for the run as well as the static link to the report which can be opened by the users later on.